Dear Friends,
Can U say ...
http://wattsupwiththat.com/2013/01/04/the-dr-david-viner-moment-weve-all-been-waiting-for-a-new-snow-record/#more-76908
Be Well.
David
Can U say ...
http://wattsupwiththat.com/2013/01/04/the-dr-david-viner-moment-weve-all-been-waiting-for-a-new-snow-record/#more-76908
Be Well.
David
UK Rainfall 2012-The Report The Met Office Should Have Produced
Guest post by Paul Homewood

According to the Met Office,
UK has just had the second wettest year on record, just behind 2000.
These claims, however, are based on records dating back to 1910. The Met
Office also keep a rainfall series for England & Wales, which date
back to 1766, and these cast a slightly different light on the matter.
(As Scotland and N Ireland have been drier than normal, the England & Wales portion becomes particularly relevant).
Figures 1 and 2 show the annual rainfall for this series, with 10 and 30 year running averages.

Figure 1

Figure 2
The following points stand out:-
1) The wettest year was 1872, when there was 1284mm,
compared to 1244mm in 2012. It was also wetter in 1768. Clearly the
impression given by the Met Office, that the rainfall last year, and in
2000, is somehow “unprecedented” is not true. One is entitled to wonder
why they made it.
2) The 30 year trend would suggest that rainfall was lower for most of the 19thC, but that it has been relatively stable since.
3) Both on 10 and 30 year trends, there have been many
years previously at the same level as now. The wettest spell was during
the 1870’s and 80’s. The 1920’s were also comparatively wet.
4) Inter-annual variability, of the sort seen in the last two years, is not uncommon, for instance 1871-72.
Seasonal Variations


Figure 3
The winter graph, of course, is for Dec 2011 – Feb 2012,
but shows the trend in recent years to drier winters, (not withstanding
December 2012, which was much wetter). In contrast, summer rainfall has
been on an increasing trend. (Figures for Spring and Autumn seem not to
offer much of a trend).
The change in Winter and Summer patterns is significant because they run counter to projections made in the UK government’s Climate Change Risk Assessment,
presumably put together with the help of the best brains that the Met
and CRU can offer, and which forecast much reduced summer, and much
higher winter precipitation.
Either their models are hopelessly wrong, or the global warming, they are predicated on, has stopped.
North v South
As the map at the top indicates, Scotland has been
relatively dry, suggesting that rain belts have shifted southwards,
bringing some of the rain Scotland normally gets down to England. And,
of course, it is no secret to Brits that the jet stream has been shifted
south of its normal position for much of the year.
Julia Slingo
has been quick to blame higher rainfall on warmer temperatures. But
does Scotland receive more rain than England because it is warmer? Is it
surrounded by warmer seas? Her argument simply does not hold water.
I mentioned the jet stream moving south, but it would be more accurate to describe it as a meridional pattern.

Low pressure systems, that tend to move faster with a
zonal flow, often become blocked with a meridional flow. for much of the
year, the UK has been stuck in the “bulge” coming down from the north,
at the same time, of course, as parts of the US has seen a block of high
pressure.
It is pretty much par for the course, that many
climatologists have been linking this phenomenon with the melting of
Arctic ice. It is, however, worth bearing in mind that Hubert Lamb found
exactly the same meridional jet flow in the 1960’s and early 70’s. In
his volume, “Climate: Present, Past & Future”, he describes the effects of the changing climate at that time, when Arctic ice was expanding:-
…….much smaller changes over middle latitudes, where the most significant feature has been the very awkward type of variability from year to year, associated with the behaviour of blocking systems and meridional circulation patterns.
Examples of the consequences of these features include a number of serious items besides the extremes of cold and warmth, drought and flood associated with the occurrences of blocking in middle latitudes.
I cannot leave this North v South topic without highlighting what the
Met Office themselves have projected. In 2011, they published a report
called “Climate: Observations,projections and impacts”, which was written by a team led by a certain J Slingo. This report is absolutely clear:-
Europe shows a strong contrast in projected precipitation
changes, with large decreases in the south and large increases in the
north. The UK falls towards the northern region with generally
increasing precipitation, with projected increases of up to 10%, though
some southern parts of the UK may experience decreases of up to 5%.
There is generally good agreement between ensemble members over the
north of UK, but moderate agreement further south, indicating
uncertainty in the position of the transition zone between increasing
and decreasing precipitation over Europe.
While the exact demarcation line is not certain, they are sure that
the North will be wetter, and the South drier. This is the opposite of
what has happened in 2012.
It would appear that the Met have very little idea as to what will actually happen.
Extreme Rainfall
According to Slingo, “The
trend towards more extreme rainfall events is one we are seeing around
the world, in countries such as India and China, and now potentially
here in the UK”. But is rainfall really becoming more extreme in the UK?
While UK rainfall was 15% higher than the 1981-2010 baseline, rain
days were 10% higher, so two thirds of the extra rain can be attributed
to more rain days, rather than “heavier” rainfall.
Nevertheless, average rainfall has increased from 7.4mm to 7.8mm per
day, but this does not necessarily mean that individual days have
become more extreme. For instance, swap a day, when you get a short
shower, for a day when you get an inch of rain, and the average goes up.
Yet an inch of rain is neither extreme nor unprecedented.
So to test these “extreme rainfall” claims, I have analysed daily
rainfall records dating back to 1931 and provided by the Met, for
Oxford, which lies in the very wet belt seen on the above map , in the
south of England and to the west of London. Across this part of the
country, rainfall last year was 31% above normal.

Figure 4
Figure 4 plots the days when rainfall exceeded 26.0mm, of which there have been 99 since 1931. The following points stand out:-
1) There appear to be more days in the lower band, up to 40mm, during the past decade.
2) During 2011 and 2012, only two days appear, at 37.0mm
and 32.8mm. With 99 such days over 82 years, an average of one a year
is exactly what you would expect!
3) Most significantly though, the really “extreme” days happened decades ago. The six wettest days were :-
| Date | mm |
| 10th July 1968 | 87.9 |
| 6th Sep 1951 | 84.8 |
| 22nd June 1960 | 81.3 |
| 27th June 1973 | 67.3 |
| 12th Aug 1957 | 56.1 |
| 6th Aug 1962 | 53.3 |

Figure 5
Figure 5 shows the average number of days above 26.0mm
for each decade, and also for the last two years. It bears out the
suggestion that there has been an increase in such days between 2001 and
2010, but that the last two years are back to normal.
Conclusions
This is the detailed sort of analysis that you won’t see from the Met
Office. Instead, Slingo obsesses about global air temperatures and
extreme rainfall events.
Slingo herself admits that more work needs to be done to predict long
term trends. I would question, however, whether she is the right person
to lead this work, if she cannot take off her blinkers.
After Note
I found a couple of pictures, drawn in 1872, of the floods at Windsor
at that time. One was in January of that year and was published in the
“The Graphic Magazine”. The second relates to the floods in December
1872/January 1873 and was published in the Illustrated London News on
4th January 1873.
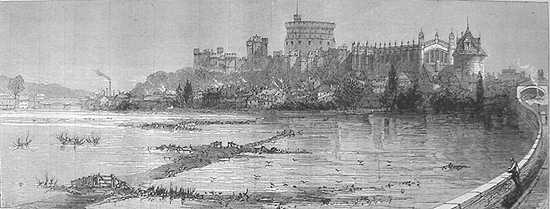
Thursday and Friday 25th and 26th January 1872.
A view from the GWR railway viaduct towards Windsor, with the floodwater reaching the lower areas of the town.
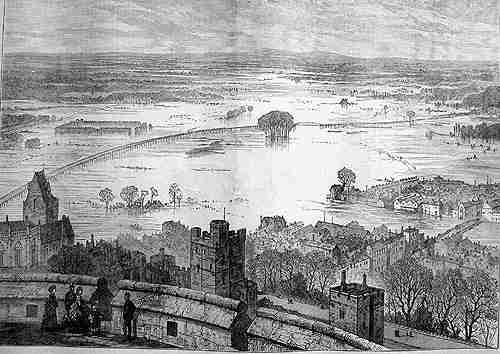
The Floods of early January 1873 from The Round Tower
Plus ca change!
References
1) All data on rainfall and raindays is from the Met Office.
2) Climate Averages
3) The England & Wales precipitation series is also from the Met.
No comments:
Post a Comment