Dear Friends, Click the link to view the images/access th links. http://wattsupwiththat.com/2010/12/20/a-dalton-minimum-repeat-is-shaping-up/ Don't forget what Maurice Cotterall has written about sunspots and the rise and fall of civilisations; http://www.mauricecotterell.com/synopsis05.htm Be Well. David
A Dalton Minimum Repeat is Shaping Up
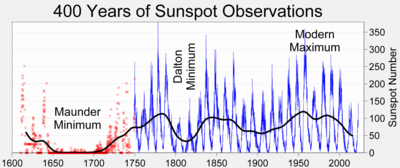
![latest[1]](http://wattsupwiththat.files.wordpress.com/2010/12/latest1.jpg?w=256&h=256) The sun went spotless yesterday, the first time in quite awhile. It seems like a good time to present this analysis from my friend David Archibald. For those not familiar with the Dalton Minimum, here’s some background info from Wiki:
The sun went spotless yesterday, the first time in quite awhile. It seems like a good time to present this analysis from my friend David Archibald. For those not familiar with the Dalton Minimum, here’s some background info from Wiki:
The Dalton Minimum was a period of low solar activity, named after the English meteorologist John Dalton, lasting from about 1790 to 1830.[1] Like the Maunder Minimum and Spörer Minimum, the Dalton Minimum coincided with a period of lower-than-average global temperatures. The Oberlach Station in Germany, for example, experienced a 2.0°C decline over 20 years.[2] The Year Without a Summer, in 1816, also occurred during the Dalton Minimum. Solar cycles 5 and 6, as shown below, were greatly reduced in amplitude. – Anthony
Guest post by David Archibald
James Marusek emailed me to ask if I could update a particular graph. Now that it is a full two years since the month of solar minimum, this was a good opportunity to update a lot of graphs of solar activity.
 Figure 1: Solar Polar Magnetic Field Strength
The Sun’s current low level of activity starts from the low level of solar polar magnetic field strength at the 23/24 minimum. This was half the level at the previous minimum, and Solar Cycle 24 is expected to be just under half the amplitude of Solar Cycle 23.
 Figure 2: Heliospheric Current Sheet Tilt Angle
It is said that solar minimum isn’t reached until the heliospheric current sheet tilt angle has flattened. While the month of minimum for the 23/24 transition is considered to be December 2008, the heliospheric current sheet didn’t flatten until June 2009.
Figure 3: Interplanetary Magnetic Field
The Interplanetary Magnetic Field remains very weak. It is almost back to the levels reached in previous solar minima.
 Figure 4: Ap Index 1932 – 2010
The Ap Index remains under the levels of previous solar minima.
Figure 5: F10.7 Flux 1948 – 2010
The F10.7 Flux is a more accurate indicator of solar activity than the sunspot number. It remains low.
Figure 6: F10.7 Flux aligned on solar minima
In this figure, the F10.7 flux of the last six solar minima are aligned on the month of minimum, with the two years of decline to the minimum and three years of subsequent rise. The Solar Cycle 24 trajectory is much lower and flatter than the rises of the five previous cycles.
Figure 7: Oulu Neutron Count 1964 – 210
A weaker interplanetary magnetic field means more cosmic rays reach the inner planets of the solar system. The neutron count was higher this minimum than in the previous record. Thanks to the correlation between the F10.7 Flux and the neutron count in Figure 8 following, we now have a target for the Oulu neutron count at Solar Cycle 24 maximum in late 2014 of 6,150.
Figure 8: Oulu Neutron Flux plotted against lagged F10.7 flux
Neutron count tends to peak one year after solar minimum. Figure 8 was created by plotting Oulu neutron count against the F10.7 flux lagged by one year. The relationship demonstrated by this graph indicates that the most likely value for the Oulu neutron count at the Solar Cycle 24 maximum expected to be a F10.7 flux value of 100 in late 2014 will be 6,150.
Figure 9: Solar Cycle 24 compared to Solar Cycle 5
I predicted in a paper published in March 2006 that Solar Cycles 24 and 25 would repeat the experience of the Dalton Minimum. With two years of Solar Cycle 24 data in hand, the trajectory established is repeating the rise of Solar Cycle 5, the first half of the Dalton Minimum. The prediction is confirmed. Like Solar Cycles 5 and 6, Solar Cycle 24 is expected to be 12 years long. Solar maximum will be in late 2014/early 2015.
Figure 10: North America Snow Cover Ex-Greenland
The northern hemisphere is experiencing its fourth consecutive cold winter. The current winter is one of the coldest for a hundred years or more. For cold winters to provide positive feedback, snow cover has to survive from one winter to the next so that snow’s higher albedo relative to bare rock will reflect sunlight into space, causing cooler summers. The month of snow cover minimum is most often August, sometimes July. We have to wait another eight months to find out how this winter went in terms of retained snow cover. The 1970s cooling period had much higher snow cover minima than the last thirty years. Despite the last few cold winters, there was no increase in the snow cover minima. The snow cover minimum may have to get to over two million square kilometres before it starts having a significant effect.
David Archibald
December 2010
00


No comments:
Post a Comment